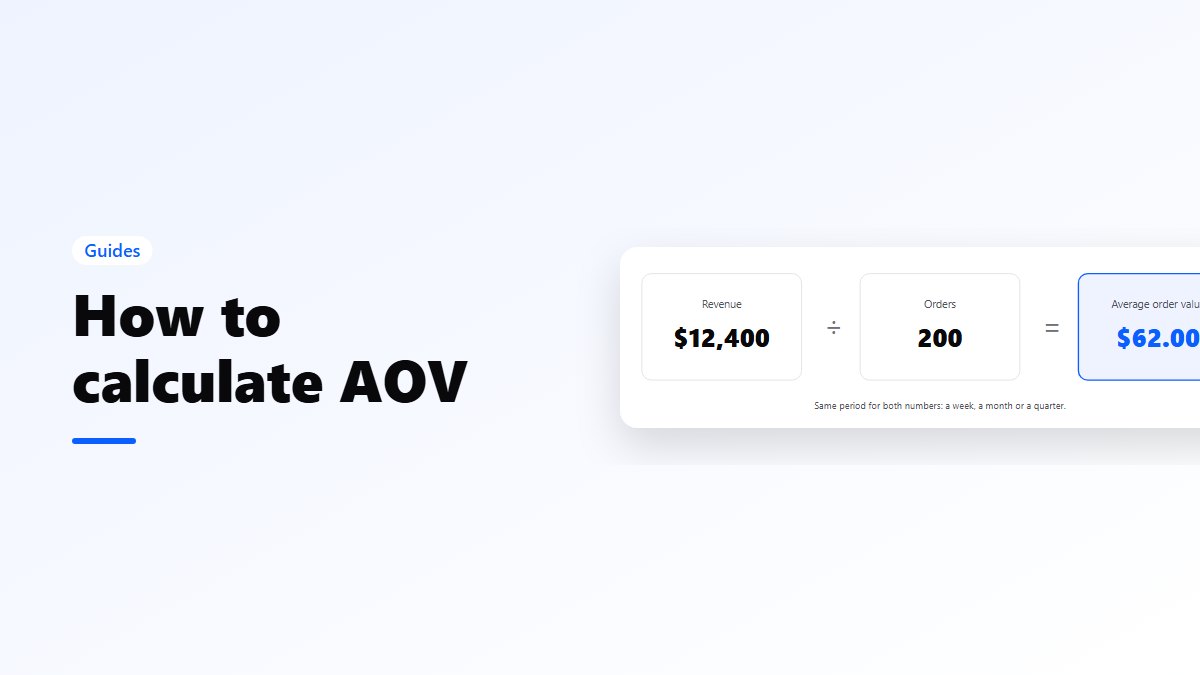
In short: average order value (AOV) is your revenue divided by your number of orders, over the same period. $12,400 from 200 orders is an AOV of $62. Decide once what counts as revenue (before or after shipping, tax, discounts and refunds) and keep it the same every month, or the trend means nothing. Dynamic Yield’s benchmark puts the global average at $182, but industries range from $59 to $421, so compare yourself with your own past months first.
The formula
AOV = revenue ÷ number of orders
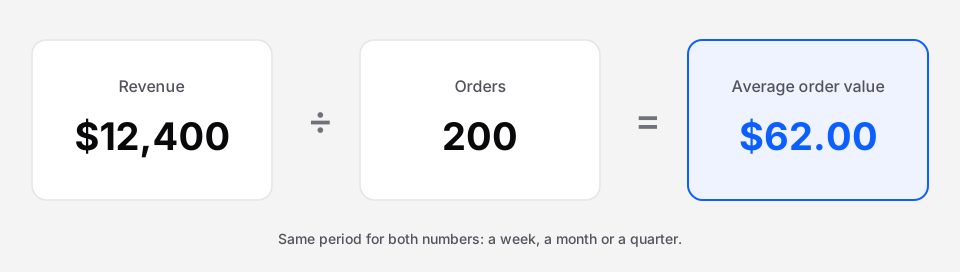 Use the same period for both numbers: a week, a month or a quarter.
That’s all the maths there is. The hard part is deciding what goes into “revenue” and “orders”.
What to count
| Count it? | Why | |
|---|---|---|
| Product revenue after discounts | Yes | It is what customers actually paid for products |
| Shipping you charged | Usually no | It pays the carrier, not you |
| Sales tax or VAT | No | It belongs to the government |
| Refunds | Subtract them | A refunded order didn’t earn anything |
| Cancelled and failed orders | No | No money changed hands |
| Free orders, such as replacements | Usually no | They pull the average down without a sale |
There is no single right answer for shipping, and tools differ. What matters is that you pick one definition and stick to it, so this month is comparable with last month.
Worked examples
A normal month. 200 orders, $12,400 in product revenue after discounts. AOV = $12,400 ÷ 200 = $62.
A month with one huge order. The same 200 orders, plus one wholesale order of $4,000. AOV = $16,400 ÷ 201 = $81.59. Your typical shopper didn’t change at all; one buyer moved the average by almost $20.
Before and after a bundle. In August: 180 orders, $10,620, AOV $59. In September, with a gift set on the best-selling product: 190 orders, $12,350, AOV $65. The bundle raised AOV by $6, and orders went up too, which is the result you want.
Mean or median?
The formula above is the mean. One big order can pull it a long way. The median is the middle order when you line them all up, and one outlier barely moves it.
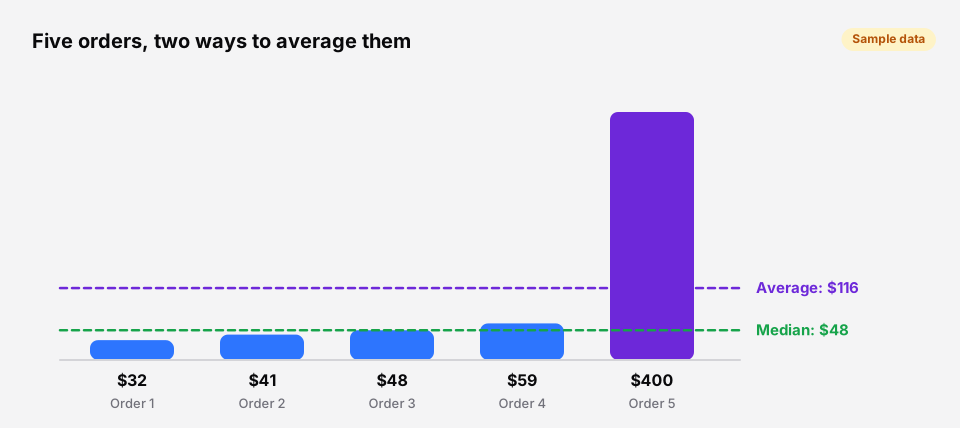 When the two numbers are far apart, a few large orders are doing the work.
If you sell to businesses as well as consumers, or have a few very large orders, look at both. A rising median means your typical shopper is spending more. A rising mean with a flat median means a few big buyers are.
AOV on its own can mislead
AOV says nothing about how many people buy. Set a free shipping goal far above what people spend, and AOV can rise while fewer visitors place an order at all.
So watch it next to revenue per visitor: revenue ÷ visitors, or conversion rate × AOV. If AOV goes up and revenue per visitor goes up too, the change worked. If AOV goes up but revenue per visitor falls, you have scared some buyers away.
Benchmarks: what is a good AOV?
Dynamic Yield, which tracks hundreds of online brands, puts the global average order value at $182. Over the past twelve months its industries range from $59 for pet care to $421 for luxury and jewelry.
Use these for context, not as a target. A store selling $15 candles will never have a jewelry store’s AOV, and doesn’t need to. The useful comparison is with yourself: this month against the same month last year, and before and after each change you make.
Where to find your AOV
- WooCommerce: WooCommerce → Analytics → Orders shows the average order value for any date range, and the Overview can show it too.
- Shopify: Analytics shows average order value on the overview dashboard and in reports.
- Google Analytics 4: the “Average purchase revenue” metric is AOV under another name.
Each tool defines revenue slightly differently, so don’t compare one tool’s number with another’s.
How to raise it
The levers that work are the ones that give shoppers a reason to add more: bundles, quantity breaks, a free shipping goal a little above your current AOV, and upsells in the cart. We cover each in how to increase average order value.
Get the plugins
- Bundles: Nanflows Bundles is free on WordPress.org for fixed bundles and frequently bought together, with bundle analytics. Pro adds quantity breaks, mix & match and more from $39 a year on the Nanflows Bundles page.
- The cart: Nanflows Sliding Cart is free. Pro adds a free shipping bar and cart upsells, from $29 a year on the Nanflows Sliding Cart page.
- Related: product bundling: types and pricing.
FAQ
What is the formula for average order value?
Average order value equals revenue divided by the number of orders over the same period. For example, $12,400 in revenue from 200 orders is an AOV of $62.
Does average order value include shipping and tax?
Usually not. Tax belongs to the government and shipping pays the carrier, so most stores calculate AOV from product revenue after discounts and refunds. Whatever you choose, keep the same definition every month.
What is a good average order value?
It depends on what you sell. Dynamic Yield’s benchmark puts the global average at $182, with industries from $59 to $421. A good AOV is one that is rising against your own past months while your conversion rate holds.
What is the difference between AOV and revenue per visitor?
AOV is revenue per order. Revenue per visitor is revenue divided by all visitors, which is conversion rate times AOV. Watch both, because AOV can rise while fewer people buy.
How do I find my average order value in WooCommerce?
Go to WooCommerce → Analytics → Orders and pick a date range. The report shows the average order value for that period, and you can compare it with an earlier one.