Help center › Manage and grow
See how your bundles sell (Analytics)
Revenue, bundles sold and orders for any dates, a daily chart, each bundle's numbers, the shopper funnel and your top products.
-
Open Analytics and pick the dates
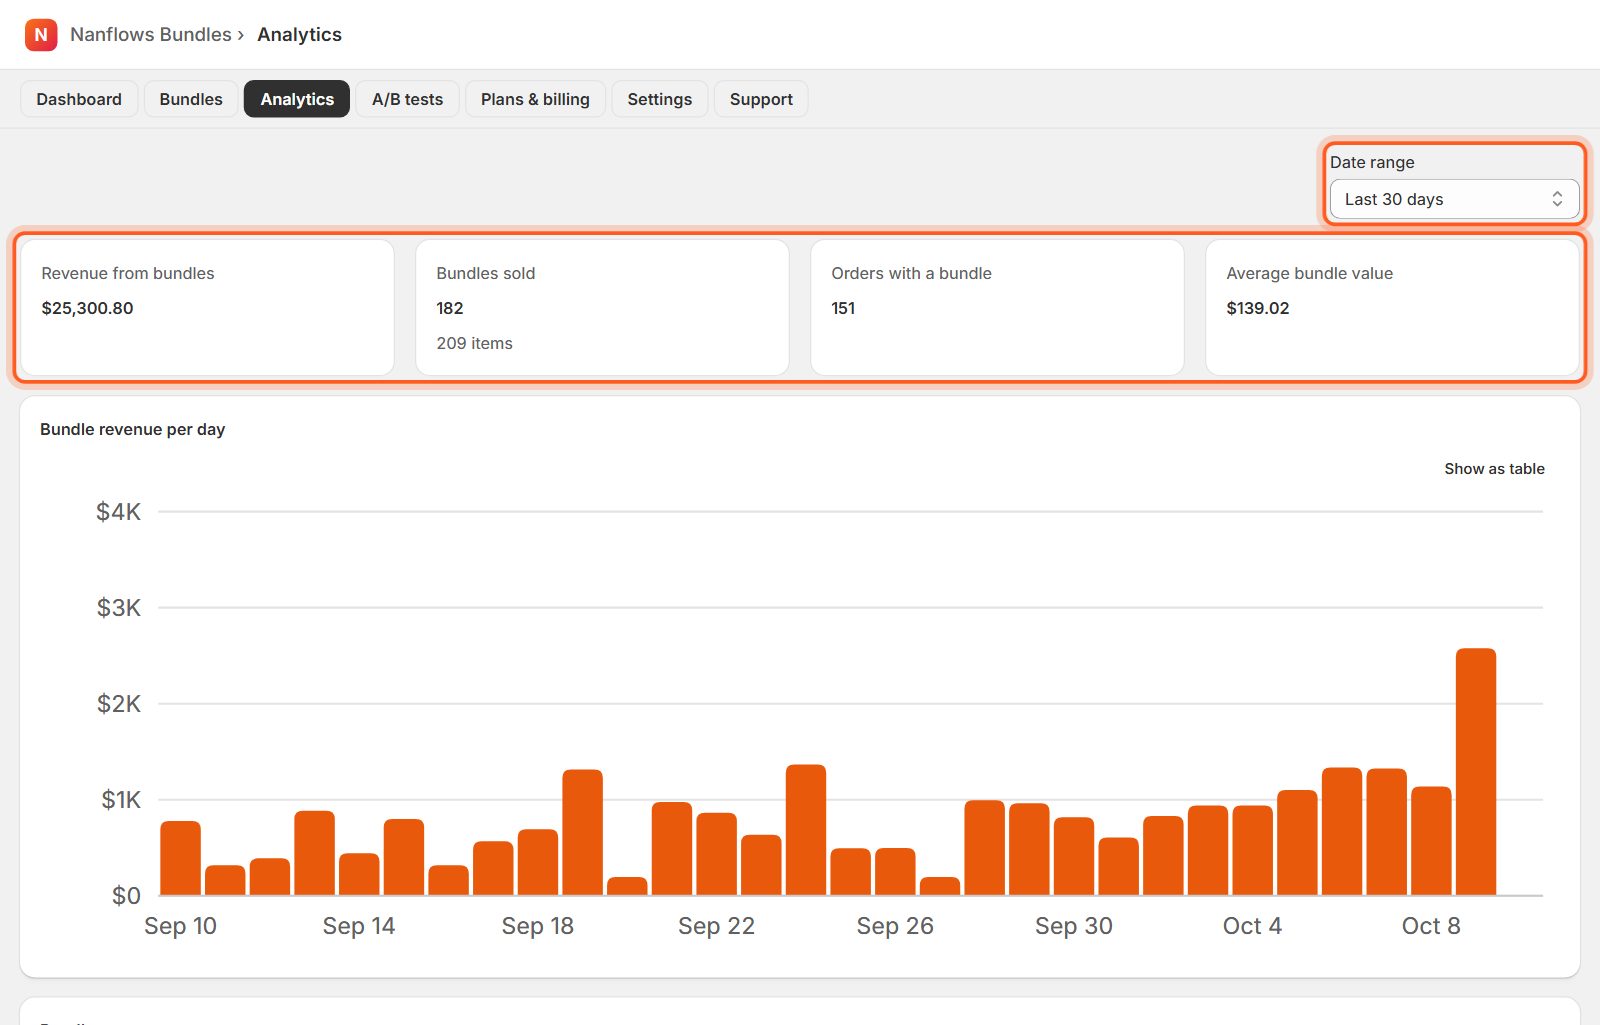
Choose Today, Last 7 days, Last 30 days, This month, All time or a Custom range. The cards show bundle revenue, bundles sold, orders with a bundle and the average bundle value.
-
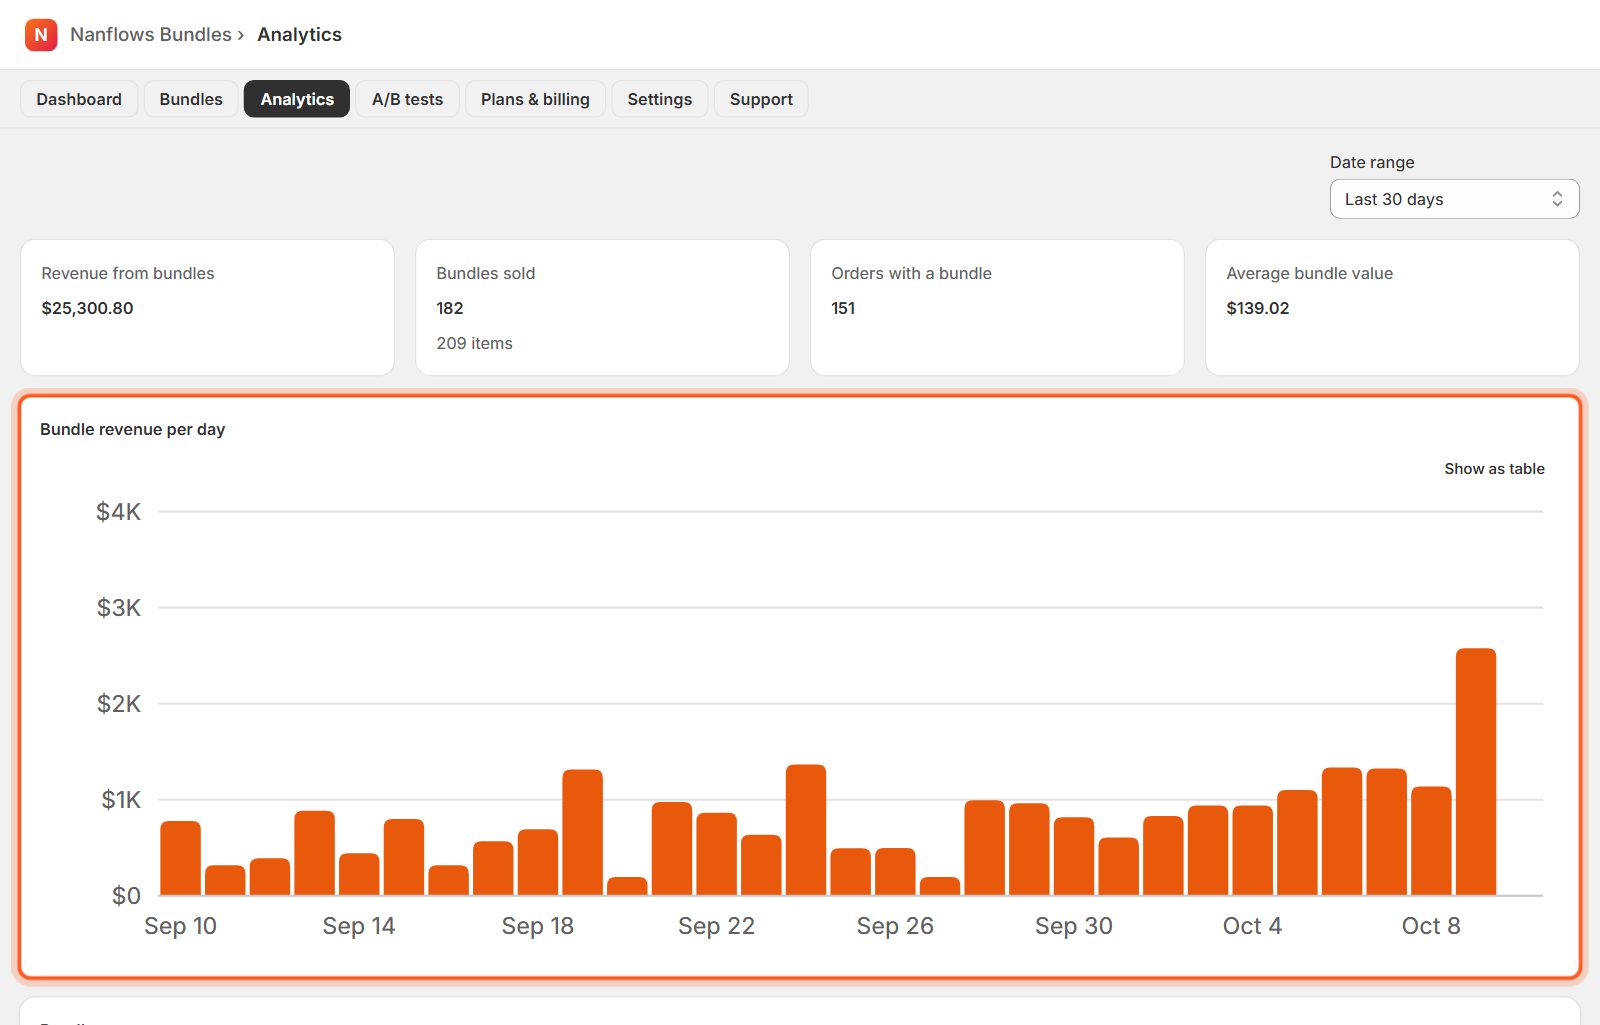
Revenue per day
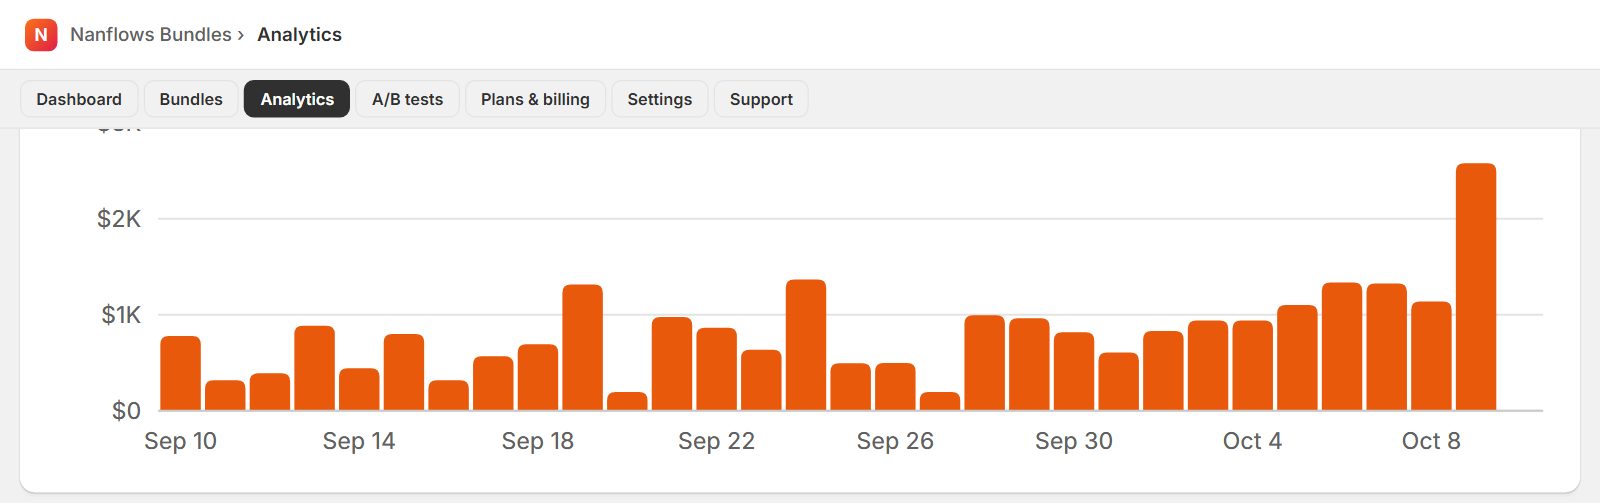
The chart shows bundle revenue for each day. Hover a bar to see the day's numbers, or click Show as table.
-
Each bundle's sales
Which bundles sell most: units sold, orders, revenue and their share of all bundle revenue.
-
Shopper funnel and top products
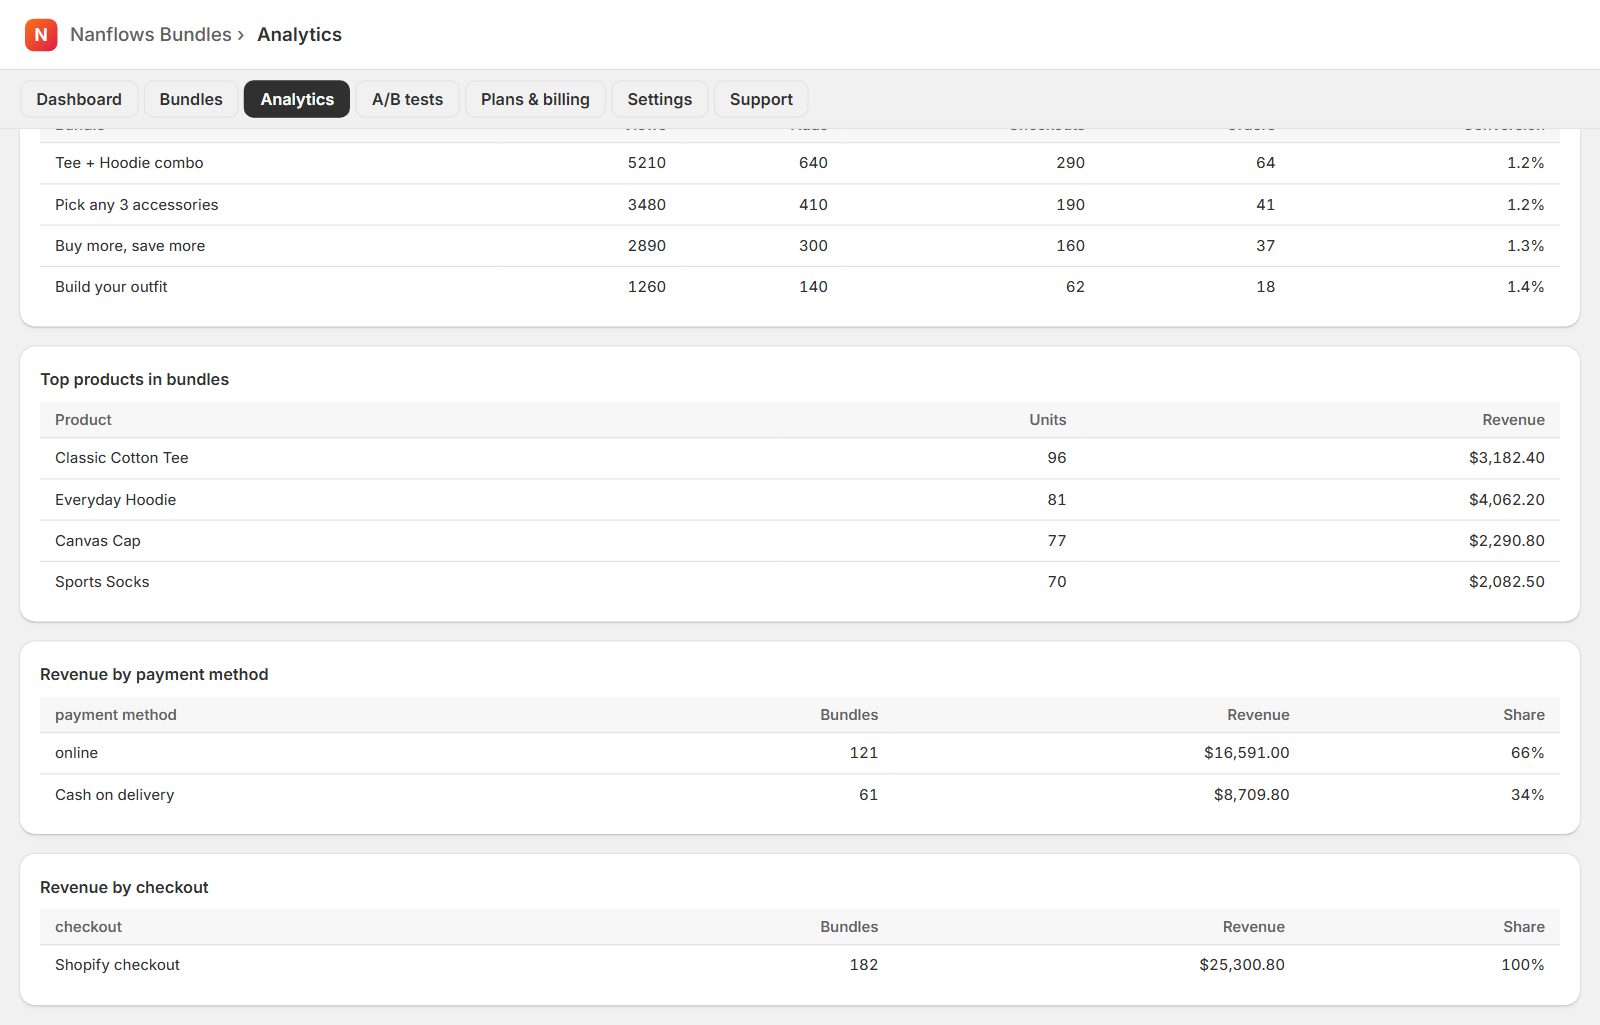
The funnel shows how many shoppers saw each bundle, added it to the cart, reached checkout and ordered. A big drop at one stage shows what to improve: the offer, the price or the design. Top products shows which products sell most inside bundles.
Nanflows Bundles for Shopify · Need help? support@nanflows.com